Taman Bukit Panchor Indah
7, Jalan Panchor Indah, Taman Panchor Indah, 14300 Nibong Tebal, Pulau Pinang, Malaysia
7, Jalan Panchor Indah, Taman Panchor Indah, 14300 Nibong Tebal, Pulau Pinang, Malaysia
| Road | Price | PSF | Size | Date | Type |
|---|
|
Lorong Panchor Indah 9
|
RM 289,000
|
RM 242
|
1,195 sqft
|
|
|
|
Jalan Panchor Indah 17
|
RM 310,000
|
RM 259
|
1,195 sqft
|
|
|
|
Lorong Panchor Indah
|
RM 350,000
|
RM 293
|
1,195 sqft
|
|
|
|
Lorong Panchor Indah 3
|
RM 276,000
|
RM 231
|
1,195 sqft
|
|
|
|
Lorong Panchor Indah 3
|
RM 250,000
|
RM 209
|
1,195 sqft
|
|
|
Lorong Panchor Indah 3
|
RM 330,000
|
RM 184
|
1,798 sqft
|
|
|
Lorong Panchor Indah 17
|
RM 400,000
|
RM 180
|
2,217 sqft
|
|
Posts about Taman Bukit Panchor Indah
No posts about Taman Bukit Panchor Indah yet. Be the first to share what’s happening here.
Promote your property to visitors of this page
Market Snapshot
ResidentialRM 310,000
RM 231 psfMedian transaction price
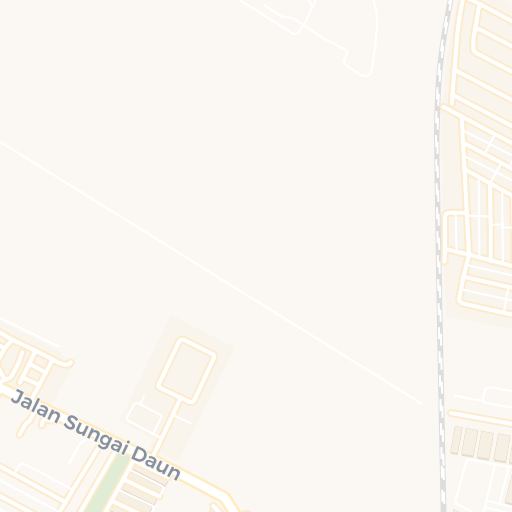
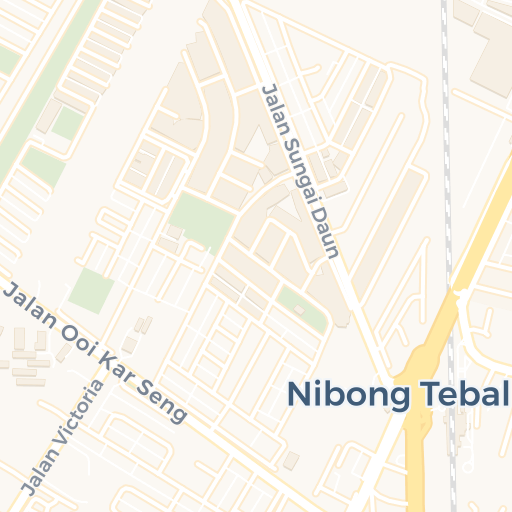
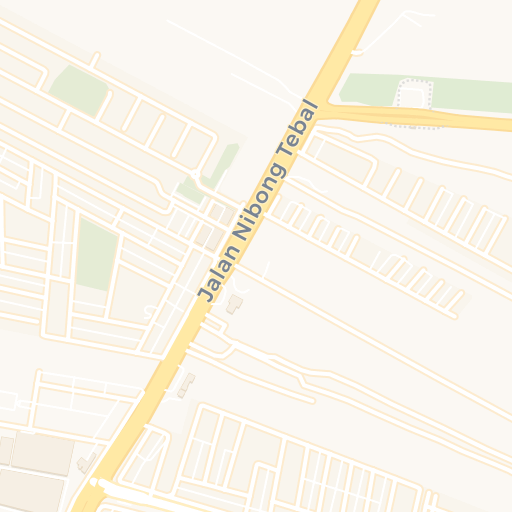
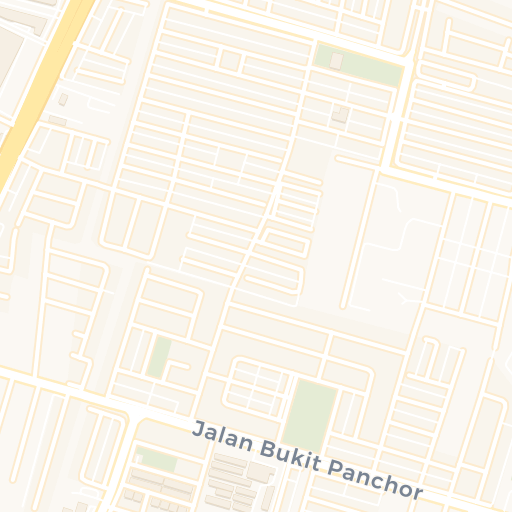
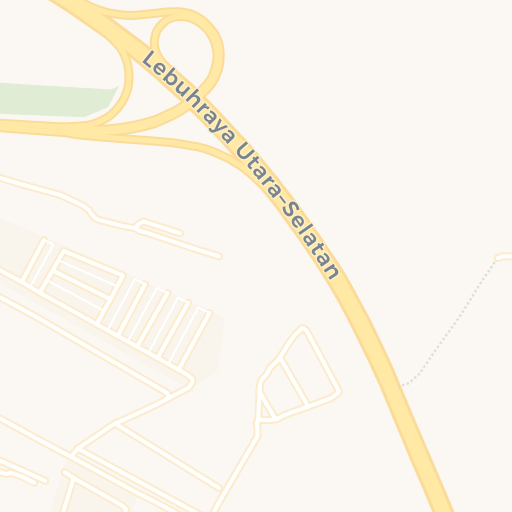
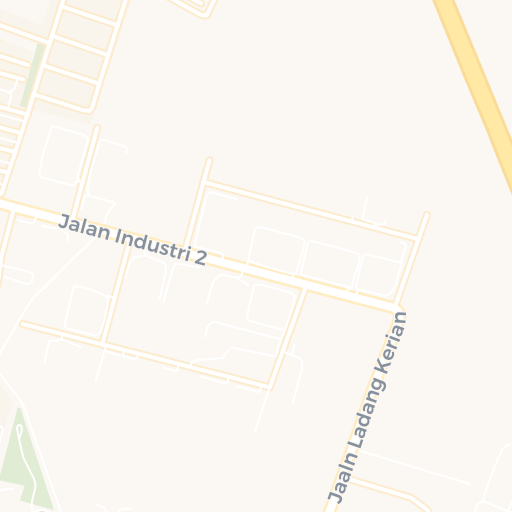
7, Jalan Panchor Indah, Taman Panchor Indah, 14300 Nibong Tebal, Pulau Pinang, Malaysia
MapsTaman Bukit Panchor Indah in Seberang Perai Selatan, Penang recorded 7 Single Storey Terraced properties subsale transactions between 2021 and 2026, with a median price of RM 310K and a median price per square foot (PSF) of RM 231.
This area consists exclusively of residential properties, with no commercial listings recorded.
Price remained flat, and PSF growth was PSF remained flat. The median price is RM 310K, with most transactions falling within a stable range of RM 264K to RM 356K, and a typical market range of RM 250K to RM 400K.
Within the Single Storey Terraced category, low-cost flat dominated the market, with high diversity across multiple property types.
The median PSF stands at RM 231, with core pricing between RM 193 and RM 269. Market pricing typically extends from RM 169.75 to RM 292.25, reflecting moderate variation in unit pricing. The spread of RM 122.50 (IQR) and deviation of RM 38 (MAD) suggest moderate price variations reflecting different property features.
While the area has shown positive growth trends, price variations suggest a more dynamic market. This presents opportunities for investors comfortable with moderate volatility. Significant price variations suggest comparing multiple properties and timing the market carefully. Limited transaction history suggests carefully evaluating comparable sales data.