Taman Delima
43200 Kuala Lumpur, Wilayah Persekutuan Kuala Lumpur, Malaysia
43200 Kuala Lumpur, Wilayah Persekutuan Kuala Lumpur, Malaysia
| Road | Price | PSF | Size | Date | Type |
|---|
|
Jalan 40/154
|
RM 338,000
|
RM 424
|
797 sqft
|
|
|
Jalan 3/154A
|
RM 1,200,000
|
RM 774
|
1,550 sqft
|
|
Posts about Taman Delima
No posts about Taman Delima yet. Be the first to share what’s happening here.
Promote your property to visitors of this page
Market Snapshot
ResidentialRM 769,000
RM 599 psfMedian transaction price
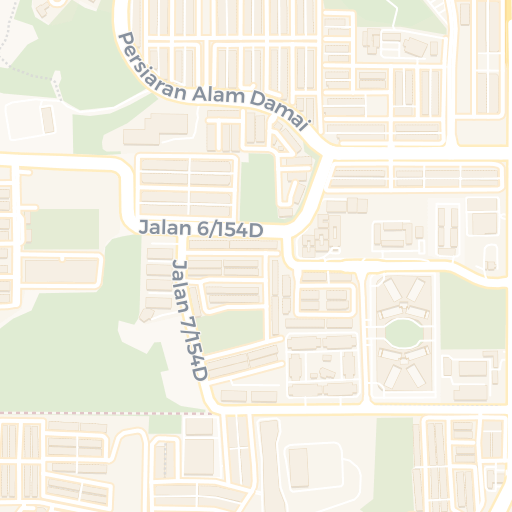
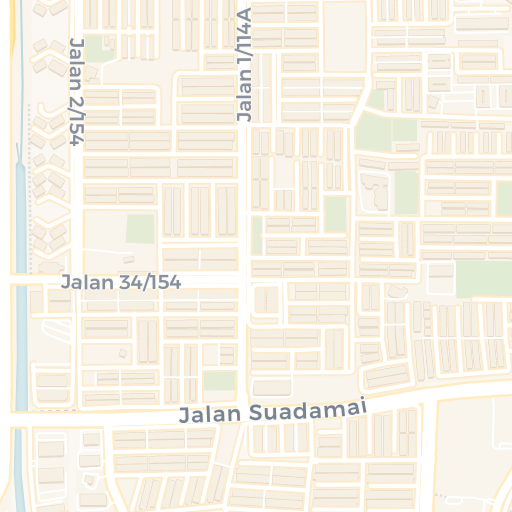
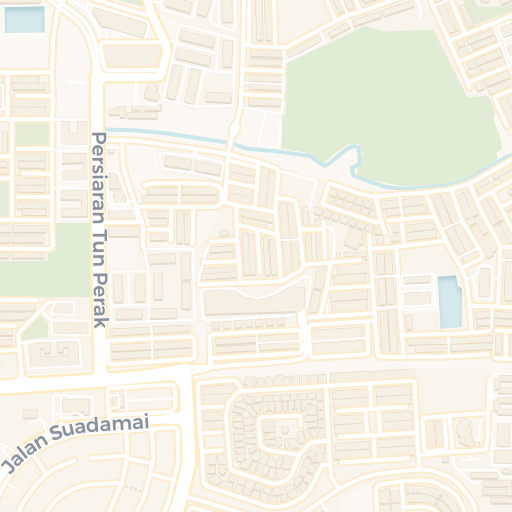
Taman Delima, 43200 Kuala Lumpur, Wilayah Persekutuan Kuala Lumpur, Malaysia
MapsTaman Delima in Kuala Lumpur, Kuala Lumpur recorded 2 subsale transactions in 2022, with a median price of RM 769K and a median price per square foot (PSF) of RM 599.
This area consists exclusively of residential properties, with no commercial listings recorded.
Price remained flat, and PSF growth was PSF remained flat. The median price is RM 769K, with most transactions falling within a stable range of RM 338K to RM 1.20 million, and a typical market range of RM 617K to RM 922K.
Most transactions involved 2 - 2 1/2 storey terraced, with minimal variety in property types.
Price per square foot shows a median of RM 599, though individual units vary from RM 424 to RM 774 in the core range. The broader market spans RM 570.52 to RM 628.02, indicating diverse property characteristics. A wider spread (IQR: RM 57.50) and deviation (MAD: RM 175) indicate significant PSF variations, likely due to diverse property types or conditions.
While the area has shown positive growth trends, price variations suggest a more dynamic market. This presents opportunities for investors comfortable with moderate volatility. Some price volatility exists, making thorough market research essential before transacting. Limited transaction history suggests carefully evaluating comparable sales data.