| Road | Price | PSF | Size | Date | Type |
|---|
|
Jalan Seri 32
|
RM 140,000
|
RM 181
|
775 sqft
|
|
|
|
Jalan Seri 29
|
RM 185,000
|
RM 239
|
775 sqft
|
|
|
|
Jalan Sri 21
|
RM 140,000
|
RM 181
|
775 sqft
|
|
|
Jalan Seri 23
|
RM 480,000
|
RM 312
|
1,539 sqft
|
|
|
|
Jalan Seri 24
|
RM 421,000
|
RM 274
|
1,539 sqft
|
|
|
Jalan Seri 16
|
RM 490,000
|
RM 303
|
1,615 sqft
|
|
|
|
Jalan Seri 12
|
RM 450,000
|
RM 279
|
1,615 sqft
|
|
|
Jalan Seri 13
|
RM 500,000
|
RM 306
|
1,636 sqft
|
|
|
Jalan Seri 10
|
RM 410,000
|
RM 116
|
3,531 sqft
|
|
Posts about Taman Sri Bakri Iii - Tr 89
No posts about Taman Sri Bakri Iii - Tr 89 yet. Be the first to share what’s happening here.
Promote your property to visitors of this page
Market Snapshot
ResidentialRM 421,000
RM 274 psfMedian transaction price
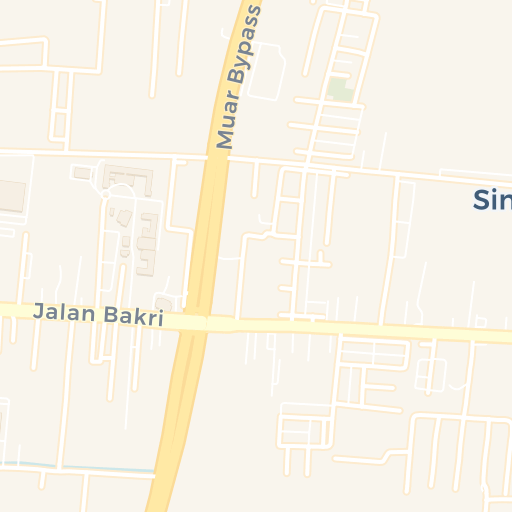


Taman Sri Bakri 3, Taman Seri Bakri 2, 84000 Muar, Johor, Malaysia
MapsTaman Sri Bakri Iii - Tr 89 in Muar, Johor recorded 9 subsale transactions in 2022, with a median price of RM 421K and a median price per square foot (PSF) of RM 274.
This area consists exclusively of residential properties, with no commercial listings recorded.
Price remained flat, and PSF growth was PSF remained flat. The median price is RM 421K, with most transactions falling within a stable range of RM 275K to RM 500K, and a typical market range of RM 263K to RM 500K.
Most transactions involved 2 - 2 1/2 storey terraced, with high diversity across multiple property types.
Price per square foot shows a median of RM 274, though individual units vary from RM 208 to RM 339 in the core range. The broader market spans RM 211.39 to RM 335.64, indicating diverse property characteristics. The spread of RM 124.25 (IQR) and deviation of RM 65 (MAD) suggest moderate price variations reflecting different property features.
While the area has shown positive growth trends, price variations suggest a more dynamic market. This presents opportunities for investors comfortable with moderate volatility. Significant price variations suggest comparing multiple properties and timing the market carefully. Limited transaction history suggests carefully evaluating comparable sales data.