| Price | PSF | Size | Date | Type |
|---|
|
RM 5,670,000
|
RM 304
|
18,675 sqft
|
|
Semi-D Factory |
|
RM 5,300,000
|
RM 284
|
18,675 sqft
|
|
Semi-D Factory |
|
RM 5,200,000
|
RM 257
|
20,268 sqft
|
|
Semi-D Factory |
|
RM 11,683,000
|
RM 275
|
42,528 sqft
|
|
Factory |
|
RM 3,079,000
|
RM 255
|
12,056 sqft
|
|
Posts about I-Park Senai Airport City (Sac)
No posts about I-Park Senai Airport City (Sac) yet. Be the first to share what’s happening here.
Promote your property to visitors of this page
Market Snapshot
CommercialRM 5,200,000
RM 265 psfMedian transaction price
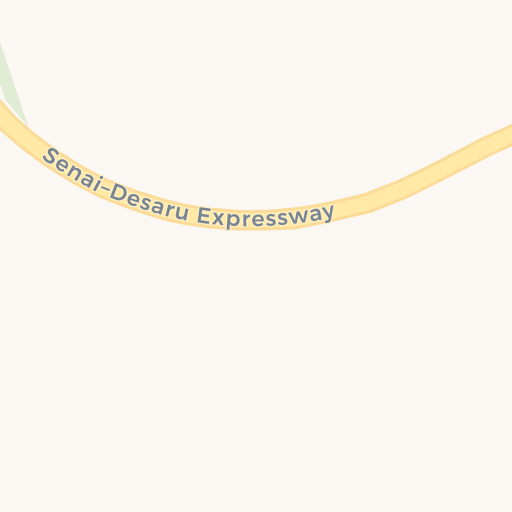
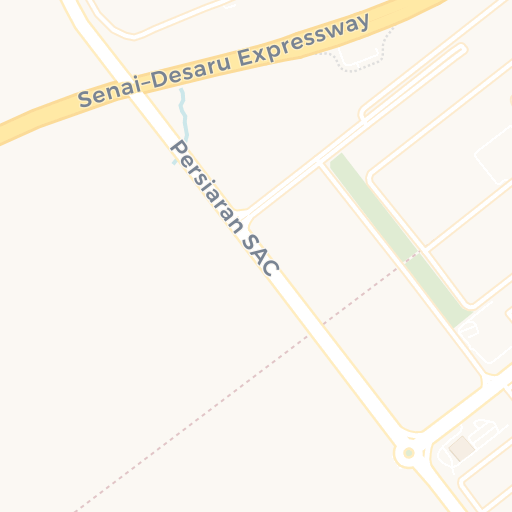
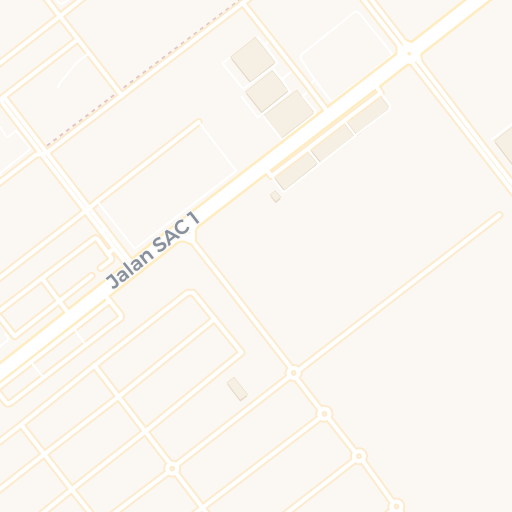
No.2, Jalan I-Park SAC 1/1, Taman Perindustrian I-Park SAC, 81400 Senai, Johor, Malaysia
MapsI-Park Senai Airport City (Sac) in Kulai, Johor recorded 7 subsale transactions between 2021 and 2026, with a median price of RM 5.30 million and a median price per square foot (PSF) of RM 265.
This area consists exclusively of commercial properties, with no residential listings recorded.
Price remained flat, and PSF growth was PSF remained flat. The median price is RM 5.30 million, with most transactions falling within a stable range of RM 3.20 million to RM 7.40 million, and a typical market range of RM 3.08 million to RM 7.54 million.
Most transactions involved semi-detached factory/warehouse, though some variety exists in the market.
For price per square foot, the median is RM 265, with most transactions between RM 255 and RM 275. The usual range is RM 253.69 to RM 277.19, showing that most units are priced quite close to each other. A typical spread (IQR) of RM 23.50 and an average deviation (MAD) of RM 10 indicate a highly stable PSF trend across properties.
While the area has shown positive growth trends, price variations suggest a more dynamic market. This presents opportunities for investors comfortable with moderate volatility. Significant price variations suggest comparing multiple properties and timing the market carefully. Limited transaction history suggests carefully evaluating comparable sales data.